

7 Ways To Use Instagram Insights To Analyze Your Organic Marketing
- Oct 25, 2021
- 8 min read

Data aids in the comprehension of your target market. It reveals how they work, their preferences, and who they are. Of course, you can make business judgments based on intuition, but you'll be much more likely to do it right if you can back up your ideas with cold, complex data.
In 2021, there will be more than 1.074 billion Instagram users on the planet.
It's no surprise that 71 percent of businesses in the United States are currently using Instagram. But, on the other hand, the most successful ones don't just throw photos and videos into the universe and hope for the best. Instead, they’ve devised a plan.
Suppose you have a business account on Instagram. In that case, you can get free analytical data on your audience and content performance right in the app: Instagram Insights is a built-in business tool on Instagram that provides access to your posts and data.
To use Insights, you'll need to switch your Instagram account to a business account if you have a personal account. Instagram will only display your metrics for material uploaded after converting your account to a business account. If you need help formulating an effective plan for your social media, hire the best social media marketing agency in Houston and gradually see the difference in your business growth.
By tapping on the three lines in the top-right area of your business profile, you can access Instagram Insights. In addition, your Instagram stats are now accessible through your professional dashboard.

You'll find a basic summary of your audience and content performance in Instagram Insights.
You may choose the date range to be displayed at the top of the screen and use Instagram's new calendar tool to modify it in ways that weren't possible before. For example, Instagram recently raised the length from 30 to 60 days, with plans to expand it to 90 days in late summer 2021.

Now we'll dig deeper into your Instagram insights for various types of posts.
1. Feed Post
Instagram Insights gives you a good idea of how well your feed postings did in audience interaction and discovery.
Scroll down to the Content You Shared area of your Insights Overview to see your posts as the first choice.
Inside Posts, Instagram will automatically organize your content by the performance so you can quickly discover which of your posts had the most engagement.

Instagram displays all forms of feed postings by default, including images, videos, and carousel posts.
You can limit the data by defining the type of post you want to see, the metrics you want to look at. These options allow you to get a general picture of your results while also tailoring them to the clear Instagram key performance indicators (KPIs) you require for your content strategy.

You can access the analytics on individual posts in Instagram Insights in addition to the comprehensive post summary. To do so, choose a base and then tap View Insights.

Individual post analytics display the total number of likes, comments, shares, saves, interactions, profile visits, accounts reached, followers, and impressions from the home, hashtags, and profile.
Instagram's KPIs for feed posts are as follows:
Instagram's algorithm is heavily influenced by post engagement. Simply put, if people aren't responding to your postings, your content won't appear in feeds. Therefore, pay special attention to the posts that receive the most engagement and consider how you may utilize them as a model for future posts. Don't be discouraged if your engagement rate is low—in 2020, the average Instagram engagement rate across all industries was only 1.22 percent. If you need to improve your social media marketing strategy, find an agency of social media marketing services in Houston and make an approach that will boost your Instagram presence.
Impressions From Home: This information indicates that your followers have seen your post in their newsfeed. In an ideal world, every one of your followers would see every one of your postings, but this is not the reality. It's a positive sign if this number is high (even better if it's close to your follower count). It signifies that the majority of the people who follow you see and react to your content in their feed.
Hashtags: If you get a lot of impressions from hashtags on Instagram, it means your hashtag strategy is working, but if you get a lot of impressions, it means you need to do some study to find more relevant hashtags. Look at what hashtags your competitors are using, and then take it from there.
2. Stories:
Instagram stories for business can reach many people, especially since Instagram Stories has over 500 million daily users. Instagram analytics are available for stories in the same manner that they are for feed posts. Scroll down to Content You Shared in your Insights Overview to find stories underneath your feed posts.

Instagram Insights will organize your stories by the most popular material. In addition, you can modify your results based on a specific date range and/or article metrics like back clicks, phone button taps, email button taps, exited, follows, next story, and business address taps for a more selective examination of your content.

Opening an active story and swiping up or pressing on the "Seen by #" in the bottom-left corner will show you insights.
6


KPI for Instagram Stories:
Completion rate: Ideally, viewers should be interested enough in your tales to watch or tap all the way through. Divide the total number of viewers from your last slide by the total number of viewers from your first slide to get your completion rate. The average rate of completion is 87 percent.
Exited: One of the most crucial variables to look at when evaluating your Instagram Stories analytics is how many people exited your story. This is usually a sign of disinterest, which you should avoid in the future.
3.IGTV Posts
You can obtain analytical data for up to two years of IGTV posts using Instagram Insights.
You can find this information in your Insights Overview by scrolling down to the IGTV section of Content You Shared, just like you can with feed posts and stories. From here, you have two options for adjusting the settings based on the metrics you wish to look at.
You can sort your IGTV videos by average % seen, comments, likes, reach, saves, shares, video views, and IGTV video interactions, then choose the time period you wish to watch them for.

While the video is playing, hit the three-dots icon at the bottom of the screen to see the Instagram analytics for that specific IGTV video.


KPIs for IGTV videos on Instagram:
Views: When someone watches your IGTV video for at least 3 seconds, a view is added to the post.
Analyze the number of likes, comments, saves, and shares. While views are crucial, these metrics give you a better idea of whether or not people are watching your video.
Audience Retention: It's common to witness a consistent drop-off in the number of people watching an IGTV video over time, especially if it's a long one. Despite the fact that IGTV films can be longer than those uploaded straight to Instagram, HubSpot discovered that videos with a duration of 26 seconds attract the most comments.
How long is too long for an audience to watch? This measure aids you in making that decision. For example, if you're routinely releasing 10-minute films and your viewers leave after four minutes, it's a good indication that your audience prefers 4- to 5-minute videos.
4. Live Video Posts
Instagram Live videos have been popular for the past year, but none of the Instagram analytics tools supplied data on them until recently.
Instagram added Live to Insights in May 2021, at the same time as it added metrics for Reels. Insights are available in all live streams created on or after May 24, 2021.
Instagram Live stats can be found in the Insights Overview under Content You Shared, just like the other things we've looked at thus far. In addition, Instagram Live analytics consists of data of accounts reached, concurrent viewers, and live interactions such as comments and shares.
KPIs for live video posts on Instagram:
Accounts Reached: While knowing how far your content reached is significant, audience engagement is more helpful in indicating the success of your content.
Peak Concurrent Viewers: This indicator indicates the most significant number of viewers who are watching the video simultaneously at any given time.
Live Interactions: Comments and shares might assist you in figuring out whether people are interested. If you have a lot of views but few comments or shares, it's a sign that your audience isn't genuinely interested in what you're saying.
5. Reels
In 2020, Instagram released Reels, and in May 2021, it added analytical insights. This section is also found in Insights, under the Content You Shared categories.
You can filter your Reels data by selecting a date within the last two years and a statistic to sort by, such as comments, likes, saves, reach, plays, shares, and interactions, just like you can with Instagram's other tools.

You may also get a detailed breakdown of the video within each reel. To see your selections, hit the three dots in the bottom right corner of your screen.
Then select View Insights from the drop-down menu.

KPIs for Reels on Instagram:
Accounts Reached: Reels reach a different audience than traditional postings. While you can post your reel to your profile like any other video, it will also appear in a curated feed within Reels tailored for the user.
Interactions: According to a 2020 study, Instagram reels have a 2.7 percent average engagement rate. This is slightly higher than the industry standard for regular videos.
6.Guides
Instagram Guides is a very new feature, and there are currently no analytical tools available for it. You won't find any analytical data in the three dots on the guide itself, nor will you discover a section for Guides among your posts, stories, reels, or IGTV and live videos in the Content You Shared part of Insights.
Instagram Guides is now a curation of existing destinations, goods, and posts. Therefore any views represented in the analytics are from the original material rather than the guide. As Instagram's features and analytical insights expand, this may change.
7.Highlight Albums
Analytical data for Instagram stories in a highlights album can be viewed similarly as ordinary stories—tap on the album to open it, then swipe up to see the insights. Interactions, profile visits, accounts reached, impressions, and new followers will all be visible.
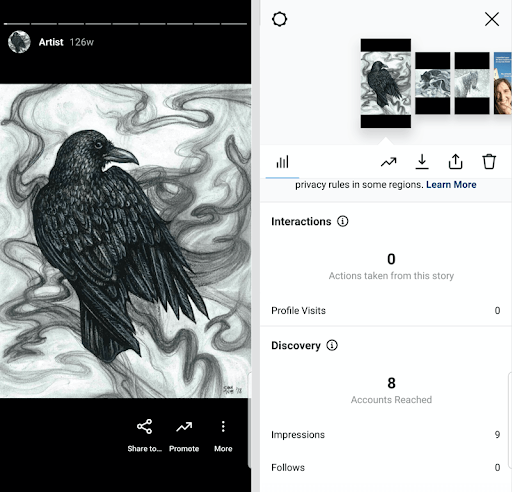
KPIs for highlights albums on Instagram:
Interactions: This area will display actions taken by users who actively engage with your content.
Discovery: While reach and impressions appear to be the same thing, they are two independent measurements. The term "reach" refers to the number of people who have seen the story at least once. The number of times your story appeared on screen is measured in impressions, which may include multiple views of your story by the same account (s).
Through Instagram Insights, you can also assess your Data. For example, accessing your audience's Instagram statistics can provide you with a detailed overview of who is viewing your material.
You may examine your audience's development, the top cities and countries where your followers are situated, the age range for men, women, or all followers, gender, and the most active times of the day and week.

This data aids in the creation of your ideal client persona and plans your posting schedule to target your followers at their most active times.
Audience KPIs on Instagram:
Follower Growth: As a part of your content strategy, it is a crucial measure to track. If you see that posting a reel resulted in a significant increase in followers, for example, that should be factored into your future strategy. Track your following growth in percentages rather than raw numbers. The average increase in followers will be between 9% and 16%. The rate of growth will vary depending on the size of your profile.
While generic tips for the ideal times to publish on social media can be beneficial, that information isn't tailored to your audience. Instead, you should use your data to determine when your followers are most engaged on social media.
Conclusion:
Instagram Insights may not have all the bells and whistles that a paid third-party scheduling and analytics program can provide. Still, as a free built-in service, it performs a fantastic job of providing the data you need to understand your audience and alter your content strategy plan. So, are you looking for a Houston best social media marketing agency? Don’t look too far. Contact Five star Social Media agencies and find experts who have. The best content marketing strategy for your business.


Comments